Showing posts with label performance. Show all posts

Tuesday, March 10, 2020

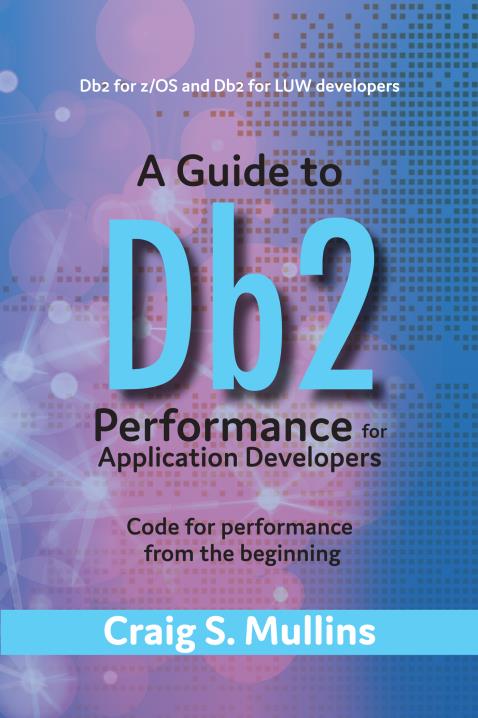
A Guide to Db2 Performance for Application Developers


DBAs: are you looking for a way to help train your developers to code more efficient Db2 application programs? 
Programmers: do you want to understand the best practices for writing high-performing Db2 applications?
Well, my latest book, A Guide to Db2 Performance for Application Developers, is just what you are looking for! Available in both printed and eBook formats, this is the book you need to assure that you are building effective, efficient Db2 applications.


This book will make you a better programmer by teaching you how to write efficient code to access Db2 databases. Whether you write applications on the mainframe or distributed systems, this book will teach you practices, methods, and techniques for optimizing your SQL and applications as you build them. Write efficient applications and become your DBA's favorite developer by learning the techniques outlined in this book!

The methods outlined in this book will help you improve the performance of your Db2 applications. The material is written for all Db2 professionals, whether you are coding on z/OS (the mainframe) or on Linux, Unix or Windows (distributed systems). When there are pertinent differences between the platforms it is explained in the text.

The focus of the book is on programming, coding and developing applications. As such, it does not focus on DBA, design, and data modeling issues, nor does it cover most Db2 utilities, DDL, and other non-programming related details. If you are a DBA, the book should still be of interest to you because DBAs are responsible for overall Db2 performance. Therefore, it makes sense to understand the programming aspect of performance.

It is important also to understand that the book is not about performance monitoring and tuning. Although these activities are important, they are typically not the domain of application developers. Instead, the book offers guidance on application development procedures, techniques, and philosophies. The goal of the book is to educate developers on how to write "good" application code that lends itself to optimal performance. By following the principles in this book you will be able to write code that does not require significant remedial, after-the-fact modifications by performance analysts. If you follow the guidelines in this book your DBAs and performance analysts will love you!

The assumption is made that the reader has some level of basic SQL knowledge and therefore it will not cover how to write Db2 SQL code or code a Db2 program. It is also important to point out that the book does not rehash material that is freely available in Db2 manuals that can be downloaded or read online.

What you will get from reading this book is a well-grounded basis for designing and developing efficient Db2 applications that perform well.

You can order your copy of A Guide to Db2 Performance for Application Developers today at:

Friday, December 27, 2019

Planning Your Db2 Performance Monitoring Strategy


The first part of any Db2 performance management strategy should be to provide a comprehensive approach to the monitoring of the Db2 subsystems operating at your shop. This approach involves monitoring not only the threads accessing Db2 and the SQL they issue, but also the DB2 address spaces. 

There are three aspects that must be addressed in order to accomplish this task:
  • Batch reports run against Db2 trace records. While Db2 is running, you can activate traces that accumulate information, which can be used to monitor both the performance of the Db2 subsystem and the applications being run. For more details on Db2 traces see my earlier 2-part blog post (part 1, part 2).
  • Online access to Db2 trace information and Db2 control blocks. This type of monitoring also can provide information on Db2 and its subordinate applications.
  • Sampling Db2 application programs as they run and analyzing which portions of the code use the most resources.

There are many in-depth details that comprise the task of setting these three components up to efficiently and effectively monitor your Db2 activity. I go over these details in my book, Db2 Developers Guide, so I direct interested parties there for the gory details.

But let's go over some performance monitoring basics. When you’re implementing a performance monitoring methodology, keep these basic caveats in mind:
  • Do not overdo monitoring and tracing. Db2 performance monitoring can consume a tremendous amount of resources. Sometimes the associated overhead is worthwhile because the monitoring (problem determination or exception notification) can help alleviate or avoid a problem. However, absorbing a large CPU overhead to monitor a Db2 subsystem that is already performing within the desired scope of acceptance might not be worthwhile.
  • Plan and implement two types of monitoring strategies at your shop:
  1. ongoing performance monitoring to ferret out exceptions, and;
  2. procedures for monitoring exceptions after they have been observed.
  • Do not try to drive a nail with a bulldozer. Use the correct tool for the job, based on the type of problem you’re monitoring. You would be unwise to turn on a trace that causes 200% CPU overhead to solve a production problem that could be solved just as easily by other types of monitoring (e.g. using EXPLAIN or Db2 Catalog reports).
  • Tuning should not consume your every waking moment. Establish your Db2 performance tuning goals in advance, and stop when they have been achieved. Too often, tuning goes beyond the point at which reasonable gains can be realized for the amount of effort exerted. (For example, if your goal is to achieve a five-second response time for a TSO application, stop when you have achieved that goal instead of tuning it further even if you can.)

Tuning goals should be set using the discipline of service level management (SLM). A service level is a measure of operational behavior. SLM ensures applications behave accordingly by applying resources to those applications based on their importance to the organization. Depending on the needs of the organization, SLM can focus on availability, performance, or both. In terms of availability, the service level can be defined as “99.95% uptime, during the hours of 9:00 AM to 10:00 PM on weekdays.” Of course, a service level can be more specific, stating “average response time for transactions will be two seconds or less for workloads of 500 or fewer users.”

For a service level agreement (SLA) to be successful, all of the parties involved must agree upon stated objectives for availability and performance. The end-users must be satisfied with the performance of their applications, and the DBAs and technicians must be content with their ability to manage the system to the objectives. Compromise is essential to reach a useful SLA.

If you do not identify service levels for each transaction, then you will always be managing to an unidentified requirement. Without a predefined and agreed upon SLA, how will the DBA and the end-users know whether an application is performing adequately? Without SLAs, business users and DBAs might have different expectations, resulting in unsatisfied business executives and frustrated DBAs... Not a good situation.

Tuesday, December 03, 2019

A Guide to Db2 Application Performance for Developers: A Holiday Discount!

Regular readers of my blog know that I have written a couple of Db2 books, including DB2 Developer's Guide, which has been in print for over 20 years across 6 different editions. But you may not be aware that I recently wrote a new Db2 book, this time focusing on the things that application programmers and developers need to do to write programs that perform well from the very start. This new book is called A Guide to Db2 Application Performance for Developers.


You see, in my current role as an independent consultant that focuses on data management issues and involves a lot of work with Db2, I get to visit a lot of different organizations... and I get to see a lot of poorly performing programs and applications. So I thought: "Wouldn't it be great if there was a book I could recommend that would advise coders on how to ensure optimal performance in their code as they write their Db2 programs?" Well, now there is... 
A Guide to Db2 Application Performance for Developers.

This book is written for all Db2 professionals, covering both Db2 for LUW and Db2 for z/OS. When there are pertinent differences between the two it will be pointed out in the text. The book’s focus is on develop­ing applications, not database and system administration. So it doesn’t cover the things you don’t do on a daily basis as an application coder.  Instead, the book offers guidance on application devel­opment procedures, techniques, and philosophies for producing optimal code. The goal is to educate developers on how to write good appli­cation code that lends itself to optimal performance. 

By following the principles in this book you should be able to write code that does not require significant remedial, after-the-fact modifications by performance ana­lysts. If you follow the guidelines in this book your DBAs and performance analysts will love you!

The book does not rehash material that is freely available in Db2 manuals that can be downloaded or read online. It is assumed that the reader has access to the Db2 manuals for their environment (Linux, Unix, Windows, z/OS).

The book is not a tutorial on SQL; it assumes that you have knowledge of how to code SQL statements and embed them in your applications. Instead, it offers advice on how to code your programs and SQL statements for performance.

What you will get from reading this book is a well-grounded basis for designing and developing efficient Db2 applications that perform well. 

OK, you may be saying, but what about that "Holiday Discount" you mention in the title? Well, I am offering a discount for anyone who buys the book before the end of the year (2019). There are different discounts and codes for the print and ebook versions of the book:


  • To receive a 5% discount on the print version of the book, use code 5poff when you order at this link.
  • To receive $5.00 off on the ebook version of the book, user code 5off when you order at this link.
These codes only work on the Bookbaby site. You can, of course, buy the book at other book stores, such as Amazon, at whatever price they are currently charging!


Happy holidays... and why not treat the programmer in your life to a copy of A Guide to Db2 Application Performance for Developers?  They'll surely thank you for it.


Friday, May 24, 2019

Time for the IDUG North American Db2 Tech Conference 2019


It is hard to believe that May is almost over already and that means that the 2019 IDUG North American Db2 Tech Conference is right round the courner! This year’s event is being held in beautiful Charlotte, NC the week of June 2-6, 2019. That is a little bit later than normal, but I think that is a good thing as it should be nice and warm in North Carolina in June!

I hope you’ve already made your plans to be there, but if you haven’t there’s still time to get your manager’s approval, make you travel plans, and be where all the Db2 folks will be the first week of June.

If you’ve ever attended an IDUG conference before then you know why I’m excited. IDUG offers a world of phenomenal educational opportunities delivered by IBM developers, vendor experts, users, and consultants from all over the world. There will be a slew of informative technical sessions on all of the latest and greatest Db2 technologies and features. The 2019 event offers more educational opportunities and training than ever before, including:
·                     Five days of educational sessions
·                     Half and full-day workshops
·                     Over 100 one-hour technical sessions
·                     Two expert panels on z/OS and LUW

If you have any doubts whether there will be something worthwhile for you there just take a look at this packed agenda! For me, one of the highlights of the conference is always the Db2 for z/OS Spotlight session. It will be delivered right after the keynote on day one by Jeff Josten, Maureen Townsend, and John Campbell. I always learn something new about what is going on with my favorite DBMS at this spotlight session.

What Am I Up to at IDUG?

As usual, I will be busy at this year’s IDUG. I will be arriving in Charlotte the Saturday before the conference to participate in some pre-conference meetings. On Saturday I’ll be meeting up with the other IBM Gold Consultants to hear from IBM and, of course, to catch up with my consultant friends. Then on Sunday I’ll be participating in Db2 customer meetings that IBM conducts to share upcoming “things” and to get feedback.

The first time you will probably get a chance to see me this year will be at the opening keynote, where I’ll be chatting on a panel about DevOps, impact on database administration and operations, and its importance moving forward.

I also will be delivering two sessions this year. My conference session is on Tuesday, June 4, at 8:00 AM (Session E05) titled Coding Db2 for Performance: By the Book. This session is based on my latest book and it is aimed at application developers. The general idea is to give an overview of the things that you can do as you design and code your Db2 programs (for z/OS or LUW) with performance in mind. All too often performance is an afterthought – and that can be quite expensive. Nail down the basics by attending this session!

I’m also delivering a vendor-sponsored presentation (or VSP) for Infotel, also on June 4th but later, at 10:40 AM. This presentation, titled Improving Db2 Application Quality for Optimizing Performance and Controlling Costs. My portion of the presentation focuses on the impact of DevOps on database; it will be followed up by Carlos Almeida of Infotel, who will talk about how their SQL quality assurance solutions can aid the DevOps process for Db2 development.

And let's not forget the exhibit hall (aka Solutions Center) where vendors present and demo their products that can help you manage Db2 more effectively. It is a good place to learn about new technology solutions for Db2, but also to hang out and meet with IBMers, consultants, and your peers.

Additionally, this year I'll be spending some time in the booth with some of my favorite Db2 vendors.
On the first day of the Solutions Center, Monday, I'll be at the BMC Software booth supporting a new DevOps-related Db2 for z/OS offering they are delivering. Be sure to stop by the BMC booth to hear about it and ask me what I think about it… and, of course, talk with BMC folks about your favorite Db2 products and see what’s new with BMC and Db2! 


On the second day of the exhibition hall, Tuesday, I'll be at the Infotel booth, but only for an hour at lunchtime. So if you have any questions we didn’t answer in the VSP, you can ask us at the Infotel booth. Be sure to stop by and say hello, take a look at Infotel’s SQL quality assurance solutions for Db2 for z/OS, and register to win one of 2 of my Db2 application performance  books that will be raffled off. If you win, be sure to get me to sign your copy!


That is a lot for one week, but there is more.

Just Look at All That IDUG Has to Offer!

You can go to full-day education sessions on Sunday June 2nd (at an additional cost – but only $250). These sessions are typically chockful of useful information that you can take home and apply to your Db2 environment. And this year there are sessions teaching how to get certified as a DBA for either z/OS or LUW or as a SYSADMIN, SQL PL best practices, and Db2 for beginners.

You can also attend one or more of the 8 different Hands-On Labs (with hands-on training led by IBM). There are hands on labs focused on diagnosing performance problems, Machine Learning for z/OS, DevOps, Mobile, Cloud and more.
There are also two different half-day workshops on June 6th – you can choose either Db2 12 for z/OS Migration Planning Workshop or Hands-on Machine Learning Bootcamp.

And don’t forget to attend one of the Special Interest Groups where you can discuss the latest industry trends and topics with other interested technicians. This year’s SIGs span the spectrum from big data to cloud to continuous delivery to IDAA and even AI.

Be sure to download the mobile app for the conference to help you navigate all the opportunities available to you! Armed with the mobile app you’ll get daily intel on what’s happening at the conference.

Justifying Your Attendance

Finally, if you need any help justifying your attendance at this year’s IDUG event, just use this justification letter as your template to create an iron-clad rationale for your boss.

The Bottom Line

The IDUG Db2 Tech Conference is the place to be to learn all about Db2 from IBMers, gold consultants, IBM champions, end users, ISVs, and more. With all of this great stuff going on this year in Charlotte, why wouldn't you want to be there!?!?

Monday, April 22, 2019

Db2 Application Testing Considerations


Testing application programs is a discipline unto itself and there are many considerations and nuances to be mastered to be able to test software appropriately. This blog post will not go into a lot of depth regarding testing practices, other than to highlight the important things to keep in mind to assure optimal performance of your Db2 applications.

Statistics

The data that you use in your test environment will not be the same as your production data. Typically, you will have less test data than you do in production. So, if you run the RUNSTATS utility on your test data you will get different statistics than in production. 

Instead of running RUNSTATS, you can test your SQL access paths by updating the test catalog statistics to be the same as your production system. Do not attempt to modify test statistics on your own. You should work with your DBA group to set up a process for up­dating test statistics. This can be accomplished in various ways. Your organization may have a tool that makes it easy to copy statistics from production to test; or your DBA team may use a DDL script of queries and modification statements to populate test statistics from production.

If your test table definitions are different in test and produc­tion you will need to take this into account in the script. For example, things like creator, name, indexes, number of parti­tions, and even columns can differ between environments. Furthermore, you may have new tables and columns for which there are no current production statistics, meaning that you will need to create estimated statistics based on your knowledge of the business and application.

Some organizations make the mistake of copying production statistics to test once, and never (or rarely) populating test again. This is a mistake because most production databases change over time, sometimes dramatically. When you run Runstats for your production applications it is a good idea to also update your test statistics from the new production statis­tics.

Modeling a Production Environment in Test

Another tactic you can use to improve the accuracy of access path testing is to model the configuration and settings of your productionenvironment in your test system. Remember that the Db2 optimizer does not just use statistics, but also infor­mation about your computing environment.

Db2 test systems typically vary from the production system. Application testing is often accomplished on test systems that have different parameters and configurations than the produc­tion systems that run the applications. Test systems usually get set up on a less powerful processor (or LPAR), and use less memory for buffering, sorting, and other system processes. This can result in different access paths for test and produc­tion systems, which can cause performance problems that only show up after you move to production.

However, it is possible to model the configuration and param­eters of your production environment in your test system. You can specify configuration details for Db2 to use for access path selection in your test system using profile tables.

Work with your DBA group to configure proper profile settings for testing your applications.

Test Cases for Skewed Data

Db2 assumes that data values are mostly uniformly distributed throughout the data. However, not all data is uniformly distributed. Db2 RUNSTATS can capture information about non-uniformly distributed and skewed data.

When data is non-uniformly distributed a subset of the values occur much more frequently than others. A special case of non-uniformly distributed data is skewed data. When data is skewed, one value (or a very small number of values) occurs much more frequently than others.

Non-uniformly distributed and skewed data presents a performance testing challenge. The Db2 optimizer can formulate different access paths for non-uniformly distributed data based on the actual values supplied. This is particularly important for dynamic SQL applications, but you should be aware of non-uniformly distributed and skewed data even for static SQL applications.

For non-uniformly distributed data you can examine the Db2 catalog to obtain values for the most commonly occurring values. For Db2 for z/OS this information is in the SYSIBM.SYSCOLDIST table.

Be sure to test with several of the values that are stored in the Colvalue column of these tables, and some that are not. This will enable you to test the performance of the most common values and less common values. The access paths may differ for each and the performance also can vary.

An Example

Let’s discuss an example. Suppose you operate a bar with a cigar room and you want to keep track of customers with a table of cigar smokers. We gather information like name, address, phone number, sex, and favorite cigar in the table. Cigar smokers skew male, so there will likely be many more rows where Sex is M, than there are where Sex is F.  With that background, consider a query like this one:

  SELECT name, phoneno, fav_cigar
  FROM   cigar_smokers
  WHERE  sex = ?;

Because the data is skewed, it is possible that Db2 will choose a different access path for M than for F. If the vast majority of the rows are men, then a table scan might be chosen for Sex = ‘M’; whereas with only a few rows for women, an index might be chosen if one exists on the Sex column.

This is just a simple example. You need to understand your data and how it skews to make sure that you create and test sample test cases for all of the pertinent values.

SQL Variations

A final performance testing consideration is to consider multiple SQL variations, especially for queries that access a lot of data or have complex access paths. Do not just find one SQL formulation that works and stick with it. Remember from earlier chapters that you can code multiple variations of SQL statements that return the same data, but that perform quite differently.


Note
This blog post was adapted and excerpted from my latest book, A Guide to Db2 Performance for Application Developers. Click the link for more information or to buy a copy (both print and ebook available).


Friday, October 19, 2018

Unboxing My Book: A Guide to Db2 Performance for Application Developers

Just a quick blog post today to show everybody that my latest book, A Guide to Db2 Performance for Application Developers, is published and ready for shipping!  I just got my author's copies as you can see in this video:


Hope you all out there in Db2-land find the book useful.

If you've bought a copyu and have any comments, please feel free to share them here on the blog.

Monday, October 15, 2018

Published and Available to be Ordered: A Guide to Db2 Performance for Application Developers

The print version of my new book, A Guide to Db2 Performance for Application Developers, can now be ordered directly from the publisher. (If you want the ebook, it can be ordered from the same link below).

Just click on the book cover below and you can order it right now! The link provides more details on the book as well as options for buying the book.


Quick information about the book: The purpose of A Guide to Db2 Performance for Application Developers is to give advice and direction to Db2 application developers and programmers to help you code efficient, well-performing programs. If you write code and access data in a Db2 database, then this book is for you. Read the book and apply the advice it gives and your DBAs will love you!

The book was written based on the latest and greatest versions of Db2 for z/OS and Db2 for LUW... and, yes, the book covers both.

If you buy the book and have any thoughts for me, drop me a comment here on the blog!

Friday, June 15, 2018

Db2 for z/OS Performance Traces Part 3 - Trace Destinations and IFCIDs


In parts 1 and 2 of this series we examined each of the six types of Db2 traces that you can start to get Db2 to record information about its activities. Be sure to check out those earlier blog posts to learn about what is available. 

Today we are going to look at a couple of additional details with regard to Db2 traces, starting with where the trace records can be written.

Trace Destinations

When a trace is started, Db2 formats records containing the requested information. After the information is prepared, it must be externalized somewhere. Db2 traces can be written to six destinations:

  • GTF, or Generalized Trace Facility, is a component of z/OS and is used for storing large volumes of trace data.
  • SMF , or System Management Facility, a source of data collection used by MVS to accumulate information and measurements. This destination is the most common for DB2 traces.
  • SRV is a routine used primarily by IBM support personnel for servicing Db2.
  • OPn, where n is a value from 1 to 8, is an output buffer area used by the Db2 Instrumentation Facility Interface (IFI).
  • OPX is a generic output buffer. When used as a destination, OPX signals Db2 to assign the next available OPn buffer (OP1 to OP8).
The Instrumentation Facility Interface, which is a DB2 trace interface, enables Db2 programs to read, write, and create Db2 trace records and issue Db2 commands. Many online Db2 performance monitors are based on the IFI.

But which trace destination should you use? Well, it depends! Consult Table 1 below for a synopsis of the available and recommended destinations for each Db2 trace type. A "Y" indicates that the specified trace destination is valid for the given type of trace; Default indicates that it is the default destination for that trace type.


Note: you can click on the Table to expand its size for easier viewing.

If you use SMF as your Db2 trace destination, consider using the SMFCOMP system parameter (DSNZPARM), which was introduced in Db2 10. This parameter causes the compression of Db2 trace records written to SMF. When SMFCOMP is set ON, the z/OS compression service CSRCESRV is used to compress any Db2 trace records written to SMF.

Use this parameter if your shop is concerned about the volume of SMF records written by Db2.

Using IFCIDs

Sometimes a trace class can be too broad, by which I mean that it generates more information than you need for the probelm at hand. This brings us to the IFCID.

Each trace class is associated with specific trace events known as Instrumentation Facility Component Identifier (IFCIDs), pronounced “if-kid.” An IFCID defines a record that represents a trace event. IFCIDs are the single smallest unit of tracing that can be invoked
by Db2.

In some cases, it can make sense to avoid activating trace classes altogether and start traces specifying only the IFCIDs needed. This way, you can reduce the overhead associated with tracing by recording only the trace events needed.

You can use trace classes 30 through 32 for starting IFCID-only traces. These classes have no predefined IFCIDs and are available for a location to use. Consider the following -START TRACE command, which starts only IFCIDs 1, 2, 42, 43, 107, and 153:

-START TRACE(PERFM) DEST(GTF) CLASS(30) IFCID(1,2,42,43,107,153)

If you do not specify the IFCID option, only those IFCIDs contained in the activated trace classes are started. The maximum number of IFCIDs per trace is 156.

Because this task can be tedious, if you decide to trace only at the IFCID level, it is probably a good idea to use a performance monitor that starts these IFCID-level traces based on menu choices. For example, if you choose to trace the elapsed time of Db2 utility jobs, the monitor or tool would have a menu option for this, initiating the correct IFCID traces (for example, IFCIDs 023 through 025).

There are several hundred different IFCIDs. Most IFCIDs contain data fields that describe events pertinent to the event being traced. Some IFCIDs have no data; instead they merely mark a specific time. For example, IFCID 074, which marks the beginning of Terminate Thread, has no data field.

Certain trace events of extended durations require a pair of IFCIDs: one for the beginning of the event and another for the end. These pairs enable the computation of elapsed times. Other trace events that are not as lengthy require only a single IFCID. 

You can find the IFCIDs associated with each trace class in the IBM DB2 Command Reference in the section describing the -START TRACE command. But that manual does not describe the purpose of each IFCID. A list describing each IFCID can be found in the SDSNIVPD(DSNWMSGS) data set. It also contains DDL and LOAD utility statements that can be used to create DB2 tables containing IFCID information that can be easily queried by SQL.

For example, the following query retrieves field descriptions for performance trace records for particular classes:

SELECT DISTINCT NAME, CLASS, DESCRIPTION, A.IFCID, SEQ
FROM   ownerid.TRACE_DESCRIPTIONS  A,
       ownerid.TRACE_TYPES         B
WHERE  A.IFCID = B.IFCID
AND    TYPE =
'PERFORMANCE'
AND    CLASS IN (1,2,3,4,5,6,7)
ORDER BY SEQ;

You can modify the query as needed to retrieve only the specific IFCID information you need.

Synopsis


This series of blog posts has offered up a high-level introduction to Db2 tracing and what type of information is available using traces. A comprehensive strategy for monitoring the performance of your Db2 subsystems and applications is an important part of establishing a best practices approach to database performance management. Use this information to help you on your journey to an efficiently monitored Db2 for z/OS environment.


Of course, this information is just the beginning. Keep checking back on this blog for additional useful information, and/or make sure you have a copy of my book, Db2 Developer's Guide, which contains over 1,600 pages of Db2 guidance and advice.


Wednesday, June 13, 2018

Db2 for z/OS Performance Traces Part 2 - Global, Monitor, Performance, and Statistics

In Part 1 of the series on Db2 performance traces we provided a general overview, as well as a discussion of the Accounting and Audit trace classes. Today, in Part 2, we will discuss the remaining 4 trace classes: Global, Monitor, Performance, and Statistics.

Global Trace


The global trace is one I hope you never have to use. It produces information that is used to service Db2, so you'd only start a global trace at the direction of IBM if you are having some sort of trouble. A global trace records information regarding entries and exits from internal Db2 modules as well as other information about Db2 internals. 

Global trace records are not accessible through normal tools that monitor Db2 performance. Most sites will never need to use the DB2 global trace. You should avoid it unless an IBM representative requests that your shop initiate it.

A global trace can add significant CPU overhead to your Db2 subsystem.

Monitor Trace

Quite a bit of useful performance monitoring information is recorded by the Db2 monitor trace. Most of the information in a monitor trace is also provided by other types of Db2 traces. The primary reason for the existence of the monitor trace type is to enable you to write application programs that provide online monitoring of Db2 performance.

Information provided by the monitor trace includes Db2 statistics and accounting trace information, as well as details of current SQL statements.

There are ten groups of DB2 monitor trace classes:
  • Class 1: Standard accounting data
  • Class 2: Entry or exit from DB2 events
  • Class 3: DB2 wait for I/O or locks
  • Class 4: Installation-defined monitor trace record
  • Class 5: Time spent processing IFI requests
  • Class 6: Changes to tables created with DATA CAPTURE CHANGES
  • Class 7: Entry or exit from event signaling package accounting
  • Class 8: Wait time for a package
  • Class 9: Statement level accounting
  • Class 10: Package detail
  • Class 11 through 28: Reserved
  • Class 29: Dynamic statement detail
  • Class 30 through 32: Local use

The overhead that results from the monitor trace depends on how it is used at your site. If it is used as recommended, class 1 is always active with 2 and 3 started and stopped as required, the overhead will likely be minimal but will depend on the activity of the Db2 system and the number of times that the other classes are started and stopped. If you make use of the reserved classes (30 through 32), or additional classes (as some vendors do), your site will incur additional overhead.

Do not start the monitor trace using DSNZPARMs unless online performance monitors in your shop explicitly require you to do so. It is best to start only monitor trace class 1 and to use a performance monitor that starts and stops the other monitor trace classes as required.

Some online performance monitoring tools do not use the monitor trace; instead, they read the information directly from the Db2 control blocks. Sampling Db2 control blocks requires less overhead than a monitor trace but it can be disruptive if the tools encounters bugs.

Performance Trace


The Db2 performance trace records an abundance of information about all types of Db2 events. You should use it only after you have exhausted all other avenues of monitoring and tuning because it consumes a great deal of system resources. When a difficult problem persists, the performance trace can provide valuable information, including SQL statement text, a complete trace of the execution of SQL statements, including details of all events, all index accesses and all data access due to referential constraints.

There are 22 groups of Db2 performance trace classes:
  • Class 1: Background events
  • Class 2: Subsystem events
  • Class 3: SQL events
  • Class 4: Reads to and writes from buffer pools and the EDM pool
  • Class 5: Writes to log or archive log
  • Class 6: Summary lock information
  • Class 7: Detailed lock information
  • Class 8: Data scanning detail
  • Class 9: Sort detail
  • Class 10: Detail on BIND, commands, and utilities
  • Class 11: Execution unit switch and latch contentions
  • Class 12: Storage manager
  • Class 13: Edit and validation exits
  • Class 14: Entry from, and exit to an application
  • Class 15: Installation-defined performance trace record
  • Class 16: Distributed processing
  • Class 17: Claim and drain information
  • Class 18: Event-based console messages
  • Class 19: Data set open and close activity
  • Class 20: Data sharing coherency summary
  • Class 21: Data sharing coherency detail
  • Class 22: Authorization exit parameters
  • Class 23 through 29: Reserved
  • Class 30 through 32: Local use

When all Db2 performance trace classes are active, you will experience significant overhead, perhaps as much as 100% CPU overhead by each program being traced. The actual overhead might be greater (or lesser) depending on actual system activity. The ­overhead when using only classes 1, 2, and 3, however, typically ranges between 5% and 30%.

Performance traces must be explicitly started with the -START TRACE command. Starting the performance trace only for the plan (or plans) you want to monitor by using the PLAN parameter of the -START TRACE command is wise. Here’s an example:

-START TRACE(PERFM) CLASS(1,2,3) PLAN(PLANNAME) DEST(GTF)

Failure to start the trace at the plan level can result in the trace being started for all plans, which causes undue overhead on all DB2 plans that execute while the trace is active.

Furthermore, due to the large number of trace records cut by the Db2 performance trace, system-wide (Db2 and non-Db2) performance might suffer because of possible SMF or GTF contention. 


Statistics Trace

The final type of Db2 trace is the statistics trace, which contains information pertaining to the entire Db2 subsystem. This type of information is particularly useful for measuring the activity and response of Db2 as a whole. Information on the utilization and status of the buffer pools, DB2 locking, DB2 logging, and DB2 storage is accumulated by the statistics trace.

There are ten groups of DB2 statistics trace classes:
  • Class 1: Statistics data
  • Class 2: Installation-defined statistics record
  • Class 3: Data on deadlocks, lock escalation, group buffers, data set extension, long-running units of recovery, and active log shortage
  • Class 4: Exceptional conditions
  • Class 5: Data sharing statistics
  • Class 6: Storage usage
  • Class 7: DRDA location statistics
  • Class 8: Data set I/O
  • Class 9 through 29: Reserved
  • Class 30 through 32: Local use

The estimated overhead of the statistics trace is low. Approximately 1% to 2% CPU overhead per transaction is incurred by the Statistics trace.

Db2 cuts a statistics trace record periodically based on the setting of the STATIME subsystem parameter (DSNZPARM). STATIME is specified as a time interval, in minutes, and can range from 1 to 60 minutes. It is a good practice to set STATIME to 1, thereby specifying 1,440 statistics intervals per day. The information accumulated by cutting these statistics trace records can provide valuable details for solving complex system problem. 
By analyzing the evolutional trend of statistics, sometimes the cause of problems can become evident that would otherwise be difficult to track down. 


Even though 1,440 records sound large, in reality the amount of data collected is small when compared to the typical volume of accounting trace data collected. An additional thousand or so SMF records should not cause any problems, while at the same time offering valuable system information.

Next time...

This concludes the overview of the types of Db2 tracing that are available. In part 3, we will examine where trace records can be written as well as more narrow tracing using IFCIDs.